Statistics Demo
The plugin provides a dashboard where you can monitor the statistics of your popups.
This demo page shows how to get to the statistics dashboard and what options it has.
Statistics Dashboard
To find the dashboard, head to the "Statistics" page under the plugin menu.
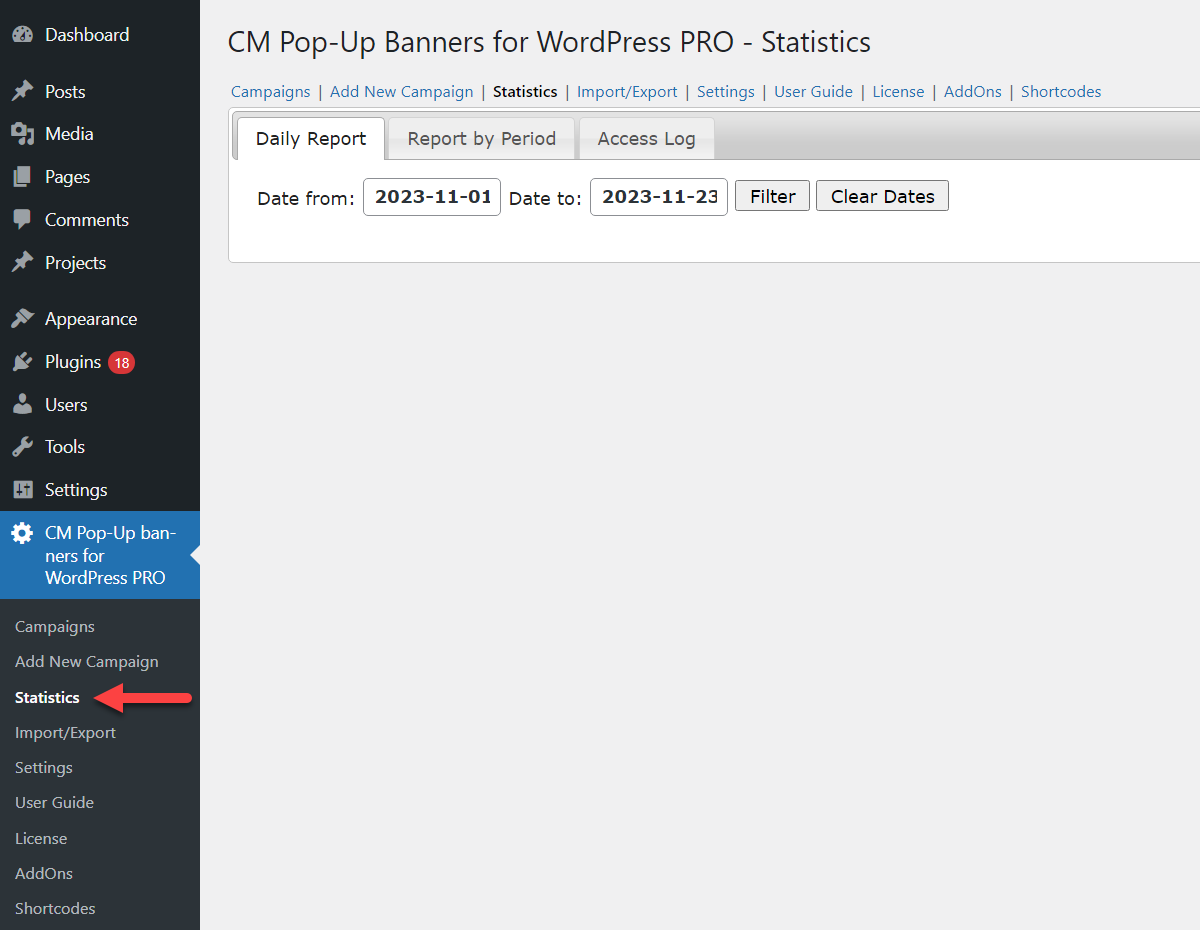
The statistics dashboard consists of 3 tabs.
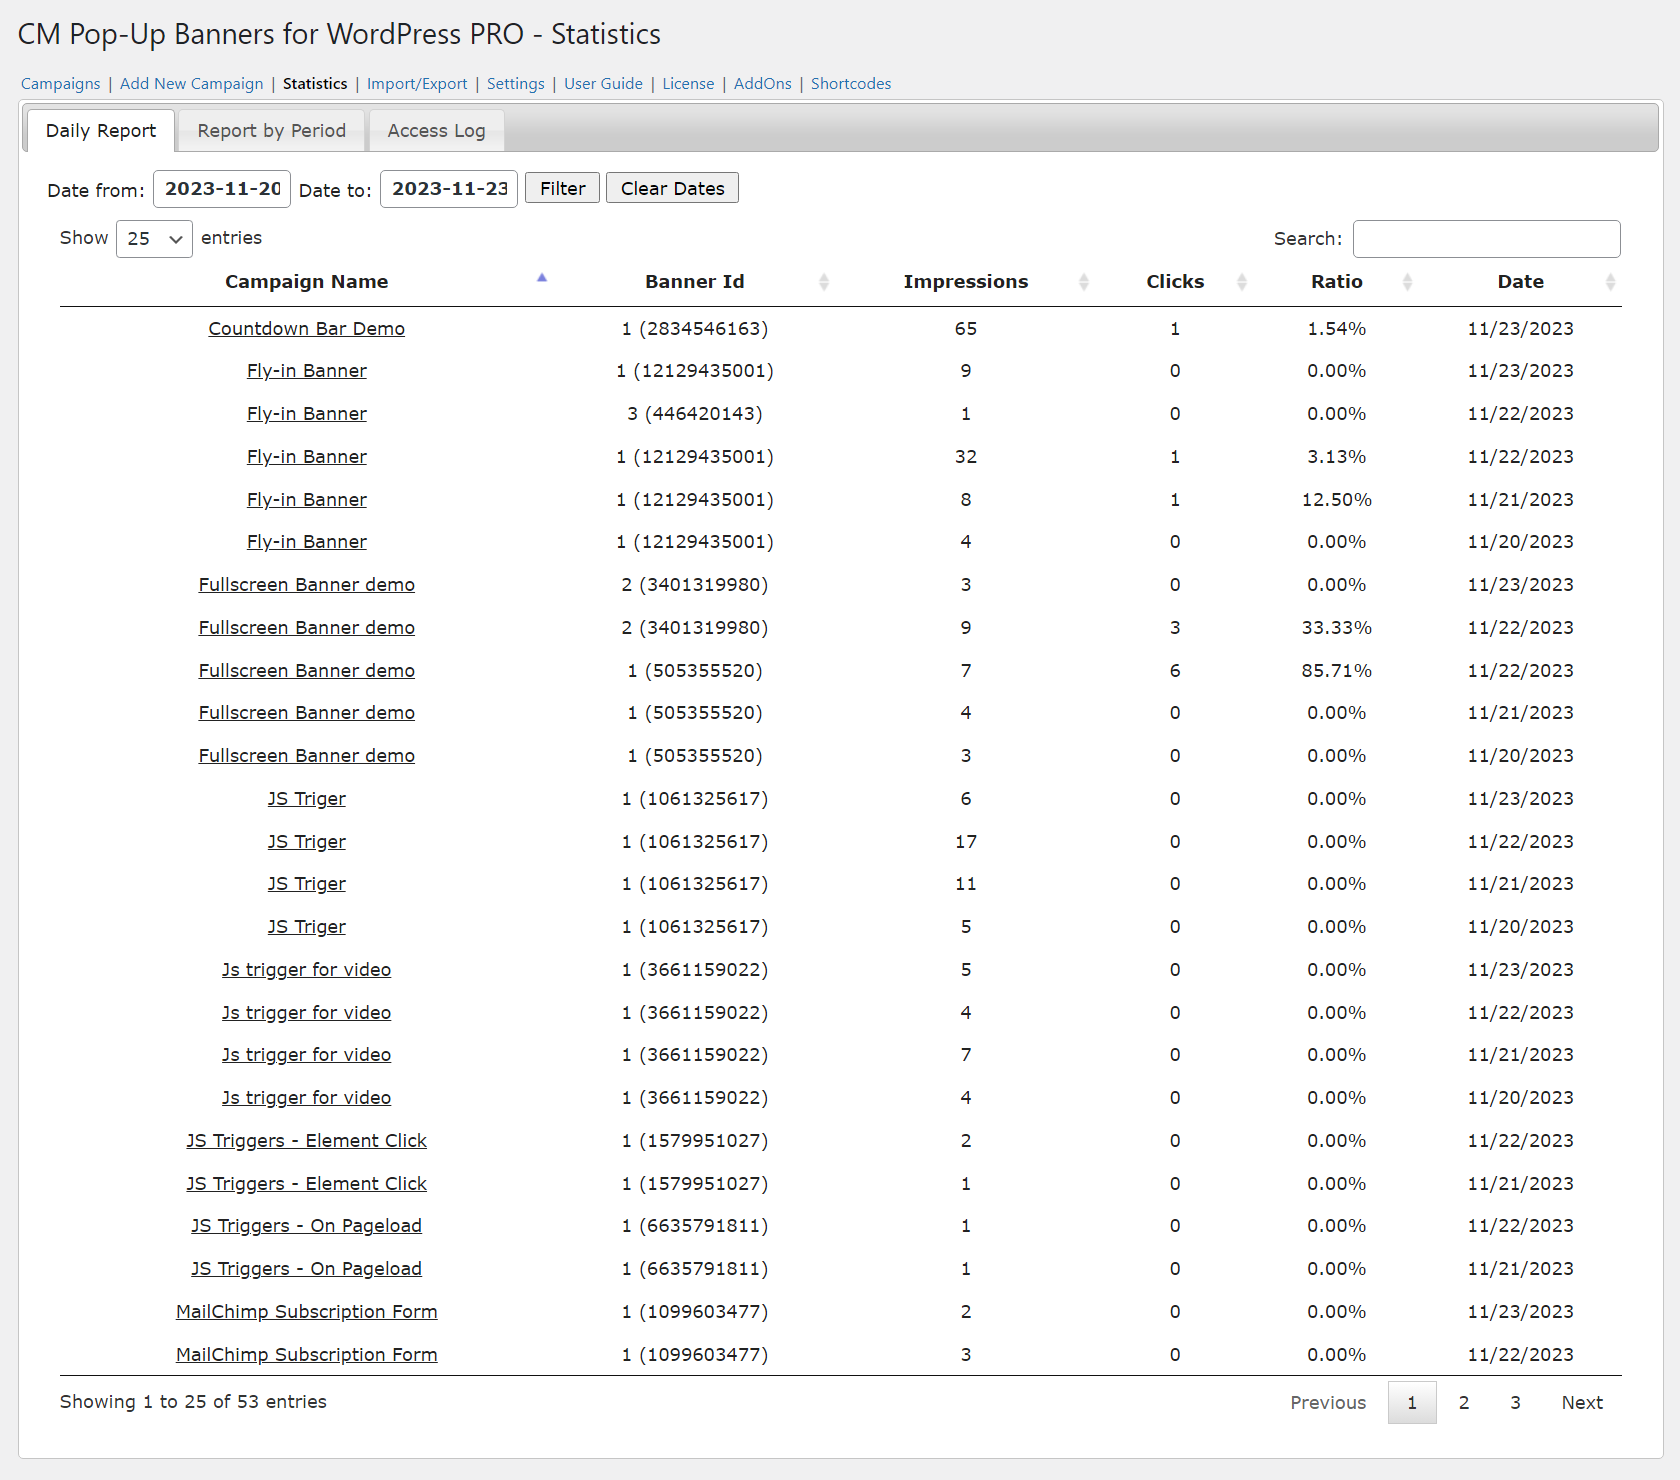
The first tab is "Daily Report". The report shows the Impressions and Clicks of all Popup Campaigns within the set time frame, divided by each day.
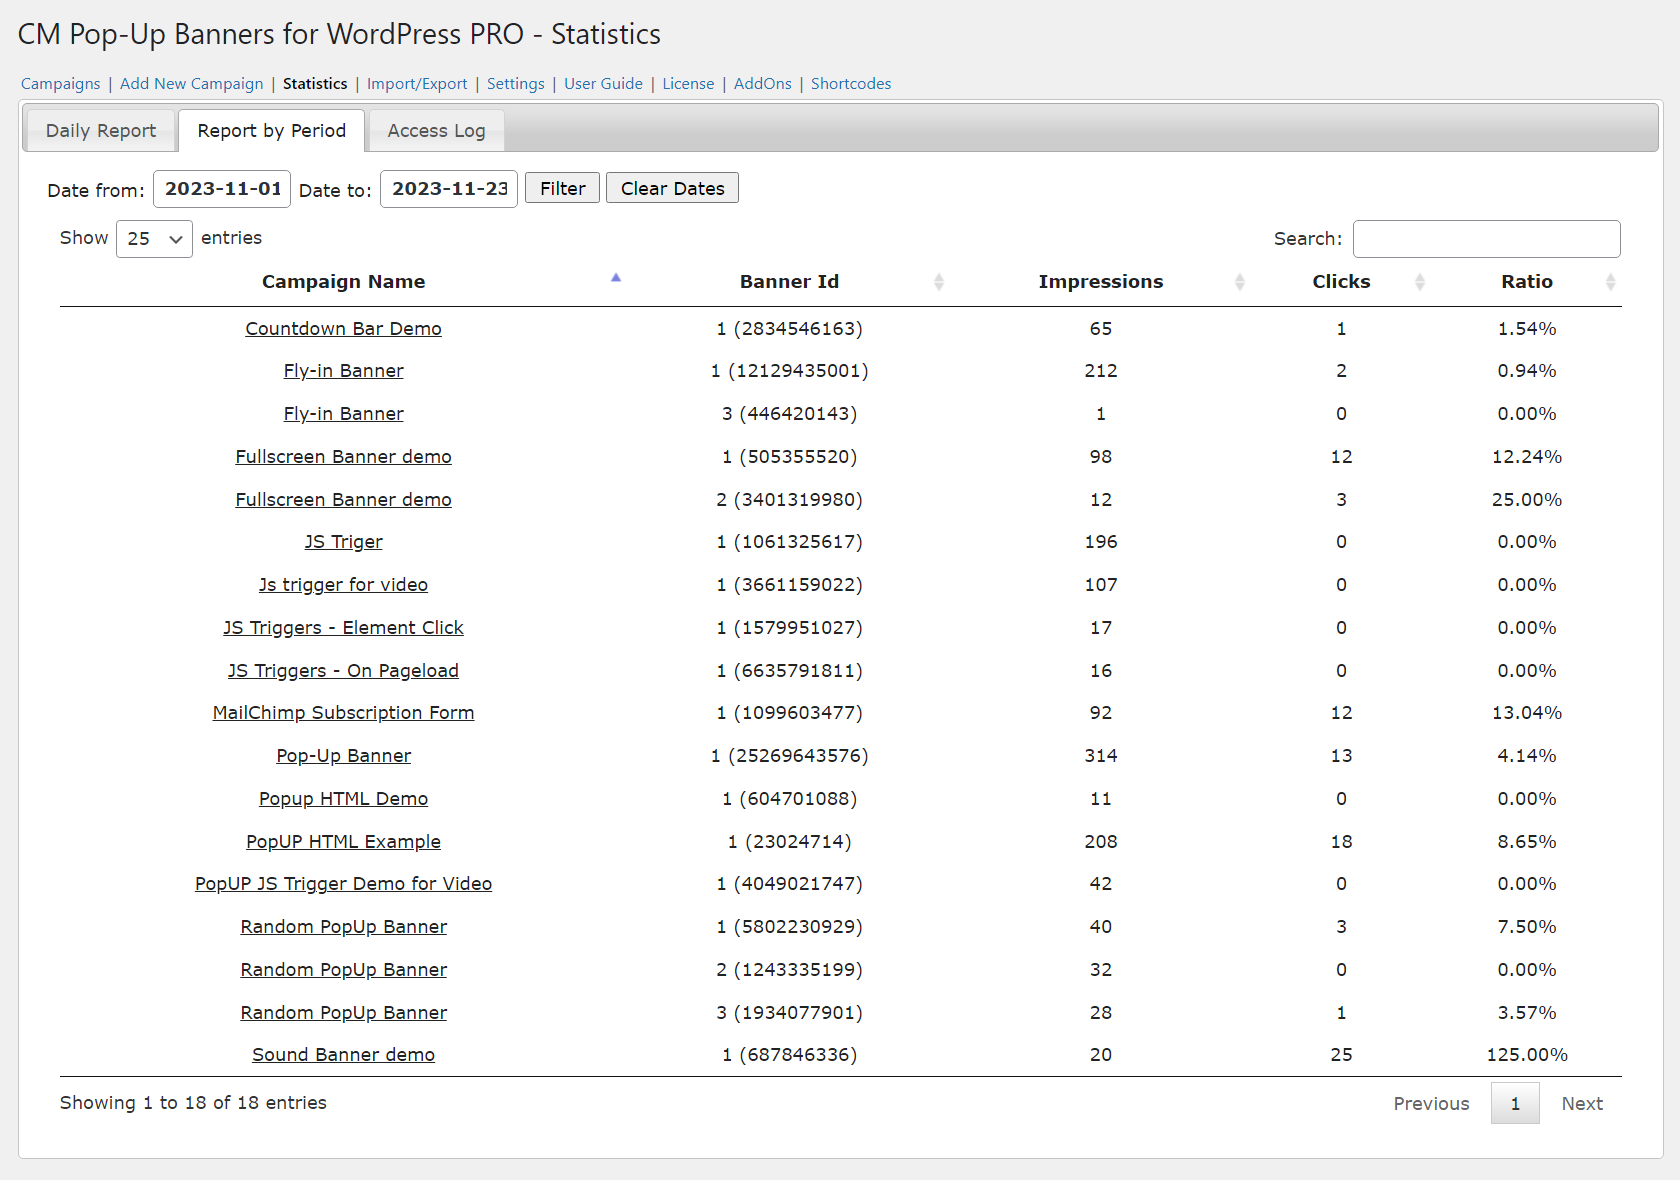
Second tab is "Report by Period". This report summarizes the usage for each popup over a period of time.
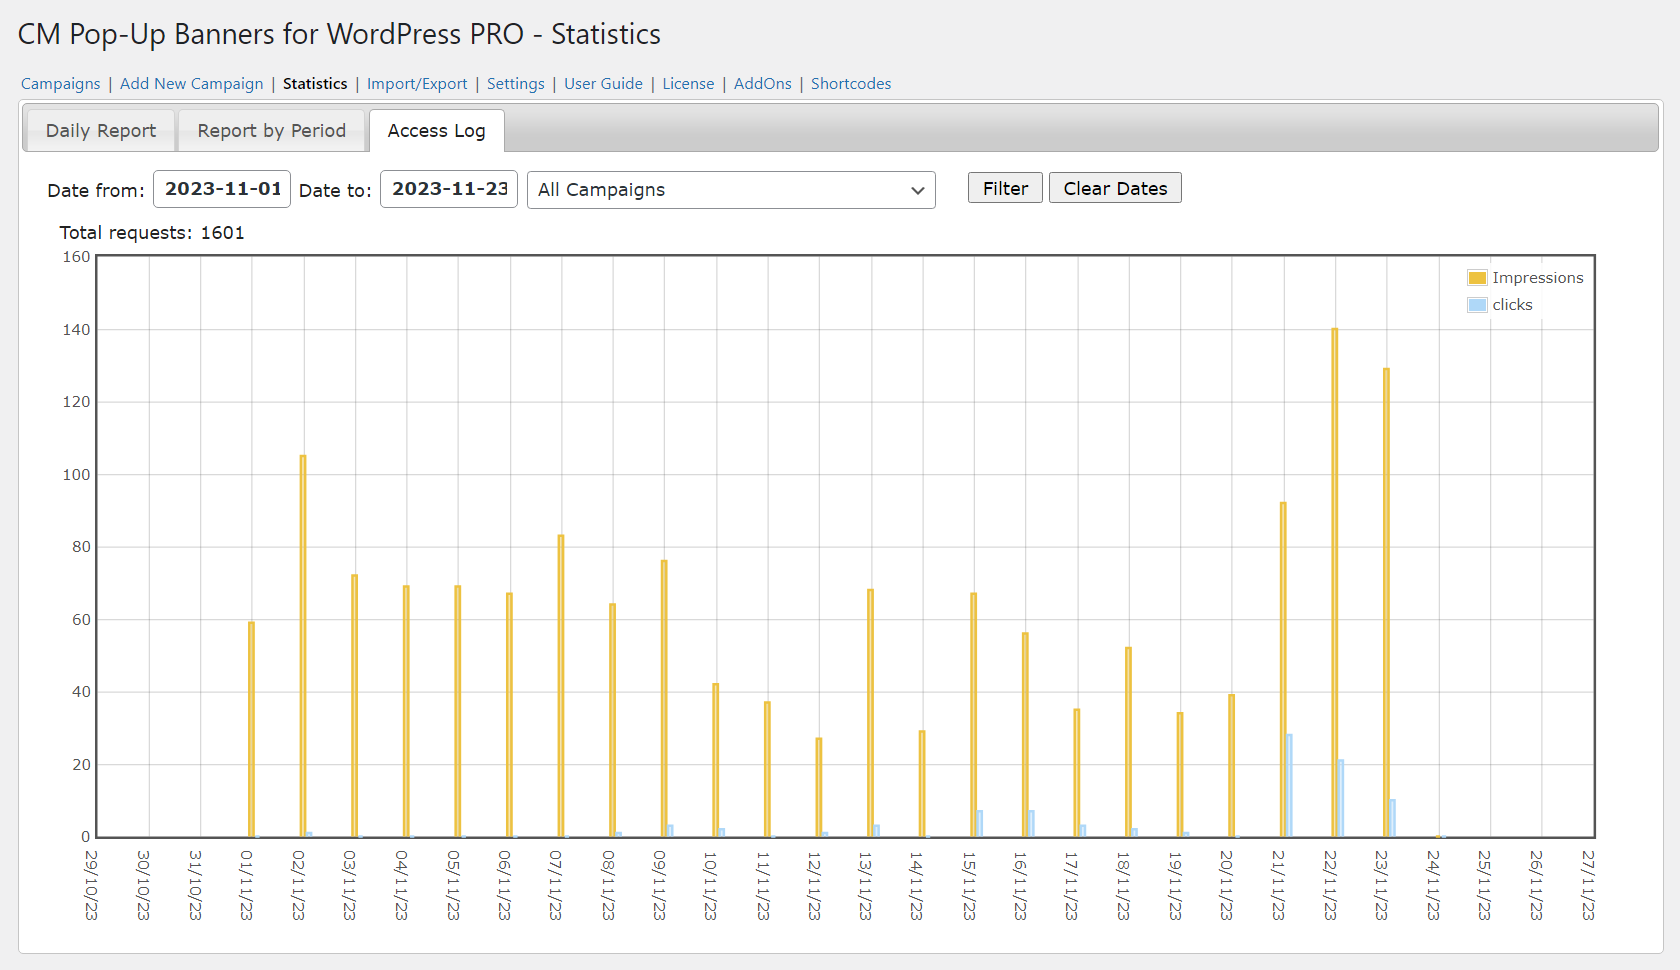
Third tab is "Access Log". It shows the overall use of popups in a histogram graph view, where the values on the X-axis are dates and on the Y-axis are numbers of requests.
CreativeMinds Popup Plugin for WordPress helps you add responsive popups to your site with custom messages and effects. Include images, videos and rich text in multiple campaigns.
Create multiple campaigns restricted by date, targeted to logged-in users and triggered by leave intent.
For more information go to the plugin product page